Structure·Centric ML
Field Note No. 04  ·  Structure-Centric ML
arXiv: 2603.13339  ·  A. Elmahdi, PhD
When the data lives in its native space, this is the stack.

The High-Dimensional Stack.

Four components — Graph-SCOPE, AdaGraph, the Density-Aware Sampler, and SLCD — operating together to produce structure-centric clusters in 100 to 5,000+ dimensions without any dimensionality reduction. The first complete clustering pipeline that survives the curse of dimensionality intact.

Four components. Native dimensionality throughout.

01

Graph-SCOPE

Unsupervised validity metric for high-dimensional clustering

The first unsupervised clustering quality metric demonstrated to maintain discriminative power at any dimensionality up to 5,000 features. Operates on a precomputed kNN graph — no pairwise distance computation. Decomposable into five components: Modularity (60%), Consistency (20%), Boundary (10%), Noise (5%), Balance (5%). Achieves 99.8% of oracle k-selection performance across 10 benchmark datasets, where Silhouette achieves 92.7%.

02

AdaGraph

Native high-dimensional structure-centric clustering algorithm

The first clustering algorithm to operate effectively in unreduced feature spaces of 100–500+ dimensions without preprocessing through PCA, UMAP, or other dimensionality reduction methods. Operates on a kNN graph constructed in the data's native feature space. 24–62% improvement in clustering quality (ARI) over HDBSCAN on real text and gene-expression data, with zero data points discarded as noise.

03

Density-Aware Sampler

Density-preserving sampling on the kNN graph

A general-purpose sampling method that preserves the density structure of arbitrary datasets through hill-climbing on a kNN graph with proportional budget allocation. Without this sampler, parameter transfer across scales would fail because uniform random sampling distorts density modes. Filed as an independent claim in the AdaGraph patent — usable with any clustering algorithm.

04

SLCD

Sample-Label-Calibrate-Deploy parameter transfer at extreme scale

Tune AdaGraph parameters on a 1,000-point sample. Deploy those exact parameters to a 500,000-point dataset in 100 dimensions. Quality is preserved — mean Δ = 0.000 across seven scaling tests on consumer hardware in under three minutes. Combined with the Density-Aware Sampler, SLCD is the operational backbone of the entire stack.

Where Silhouette collapses, Graph-SCOPE holds.

Silhouette is the standard unsupervised clustering metric used in scikit-learn, BERTopic, and thousands of production ML pipelines. It is also one of the most well-known examples of a metric that fails in high dimensions because it relies on pairwise Euclidean distances. The plot below shows Kendall's τ — the rank correlation between each metric's score and the true clustering quality — as data dimensionality grows from 2 to 5,000.
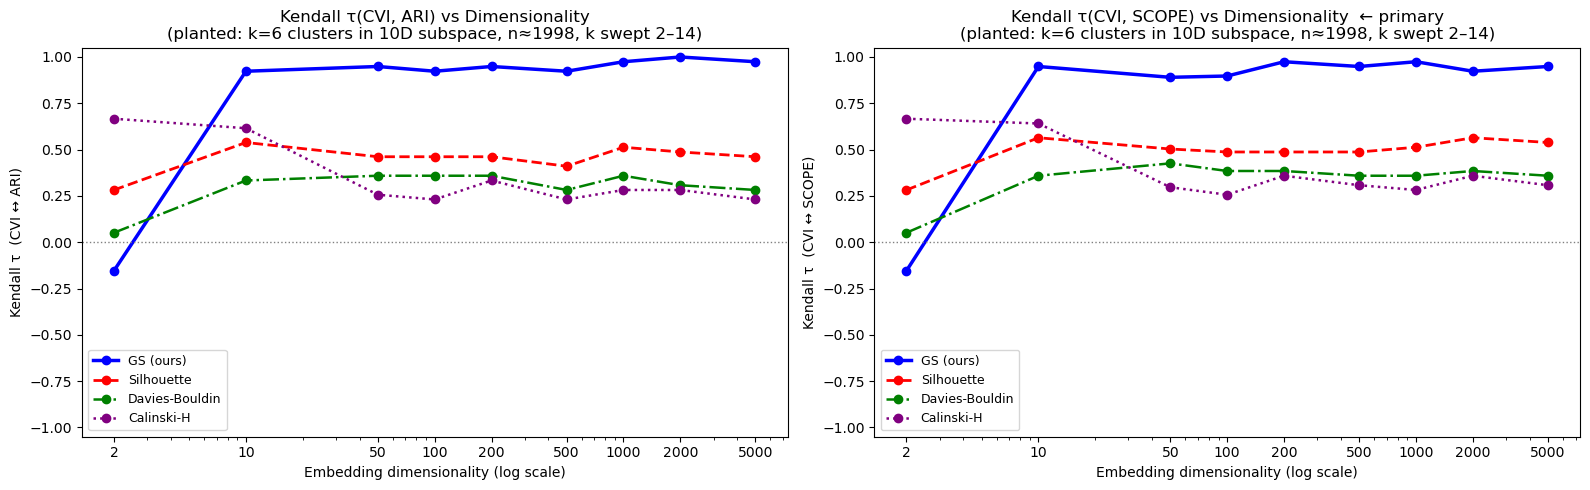
Kendall tau vs dimensionality for Graph-SCOPE, Silhouette, Davies-Bouldin, and Calinski-Harabasz
Graph-SCOPE (blue) holds at τ ≈ 0.95 from 10 to 5,000 dimensions. Silhouette (red), Davies-Bouldin (green), and Calinski-Harabasz (purple) all collapse below τ = 0.55 past 50 dimensions. Synthetic planted-structure benchmark with k=6 clusters in a 10D subspace embedded in progressively larger ambient spaces. Source: GraphSCOPE_Synthetic_Benchmark.ipynb (img-003)
0.95
Graph-SCOPE τ at 5,000D
Maintains discriminative power at extreme dimensionality.
0.46
Silhouette τ at 5,000D
Collapses to near-random ranking.
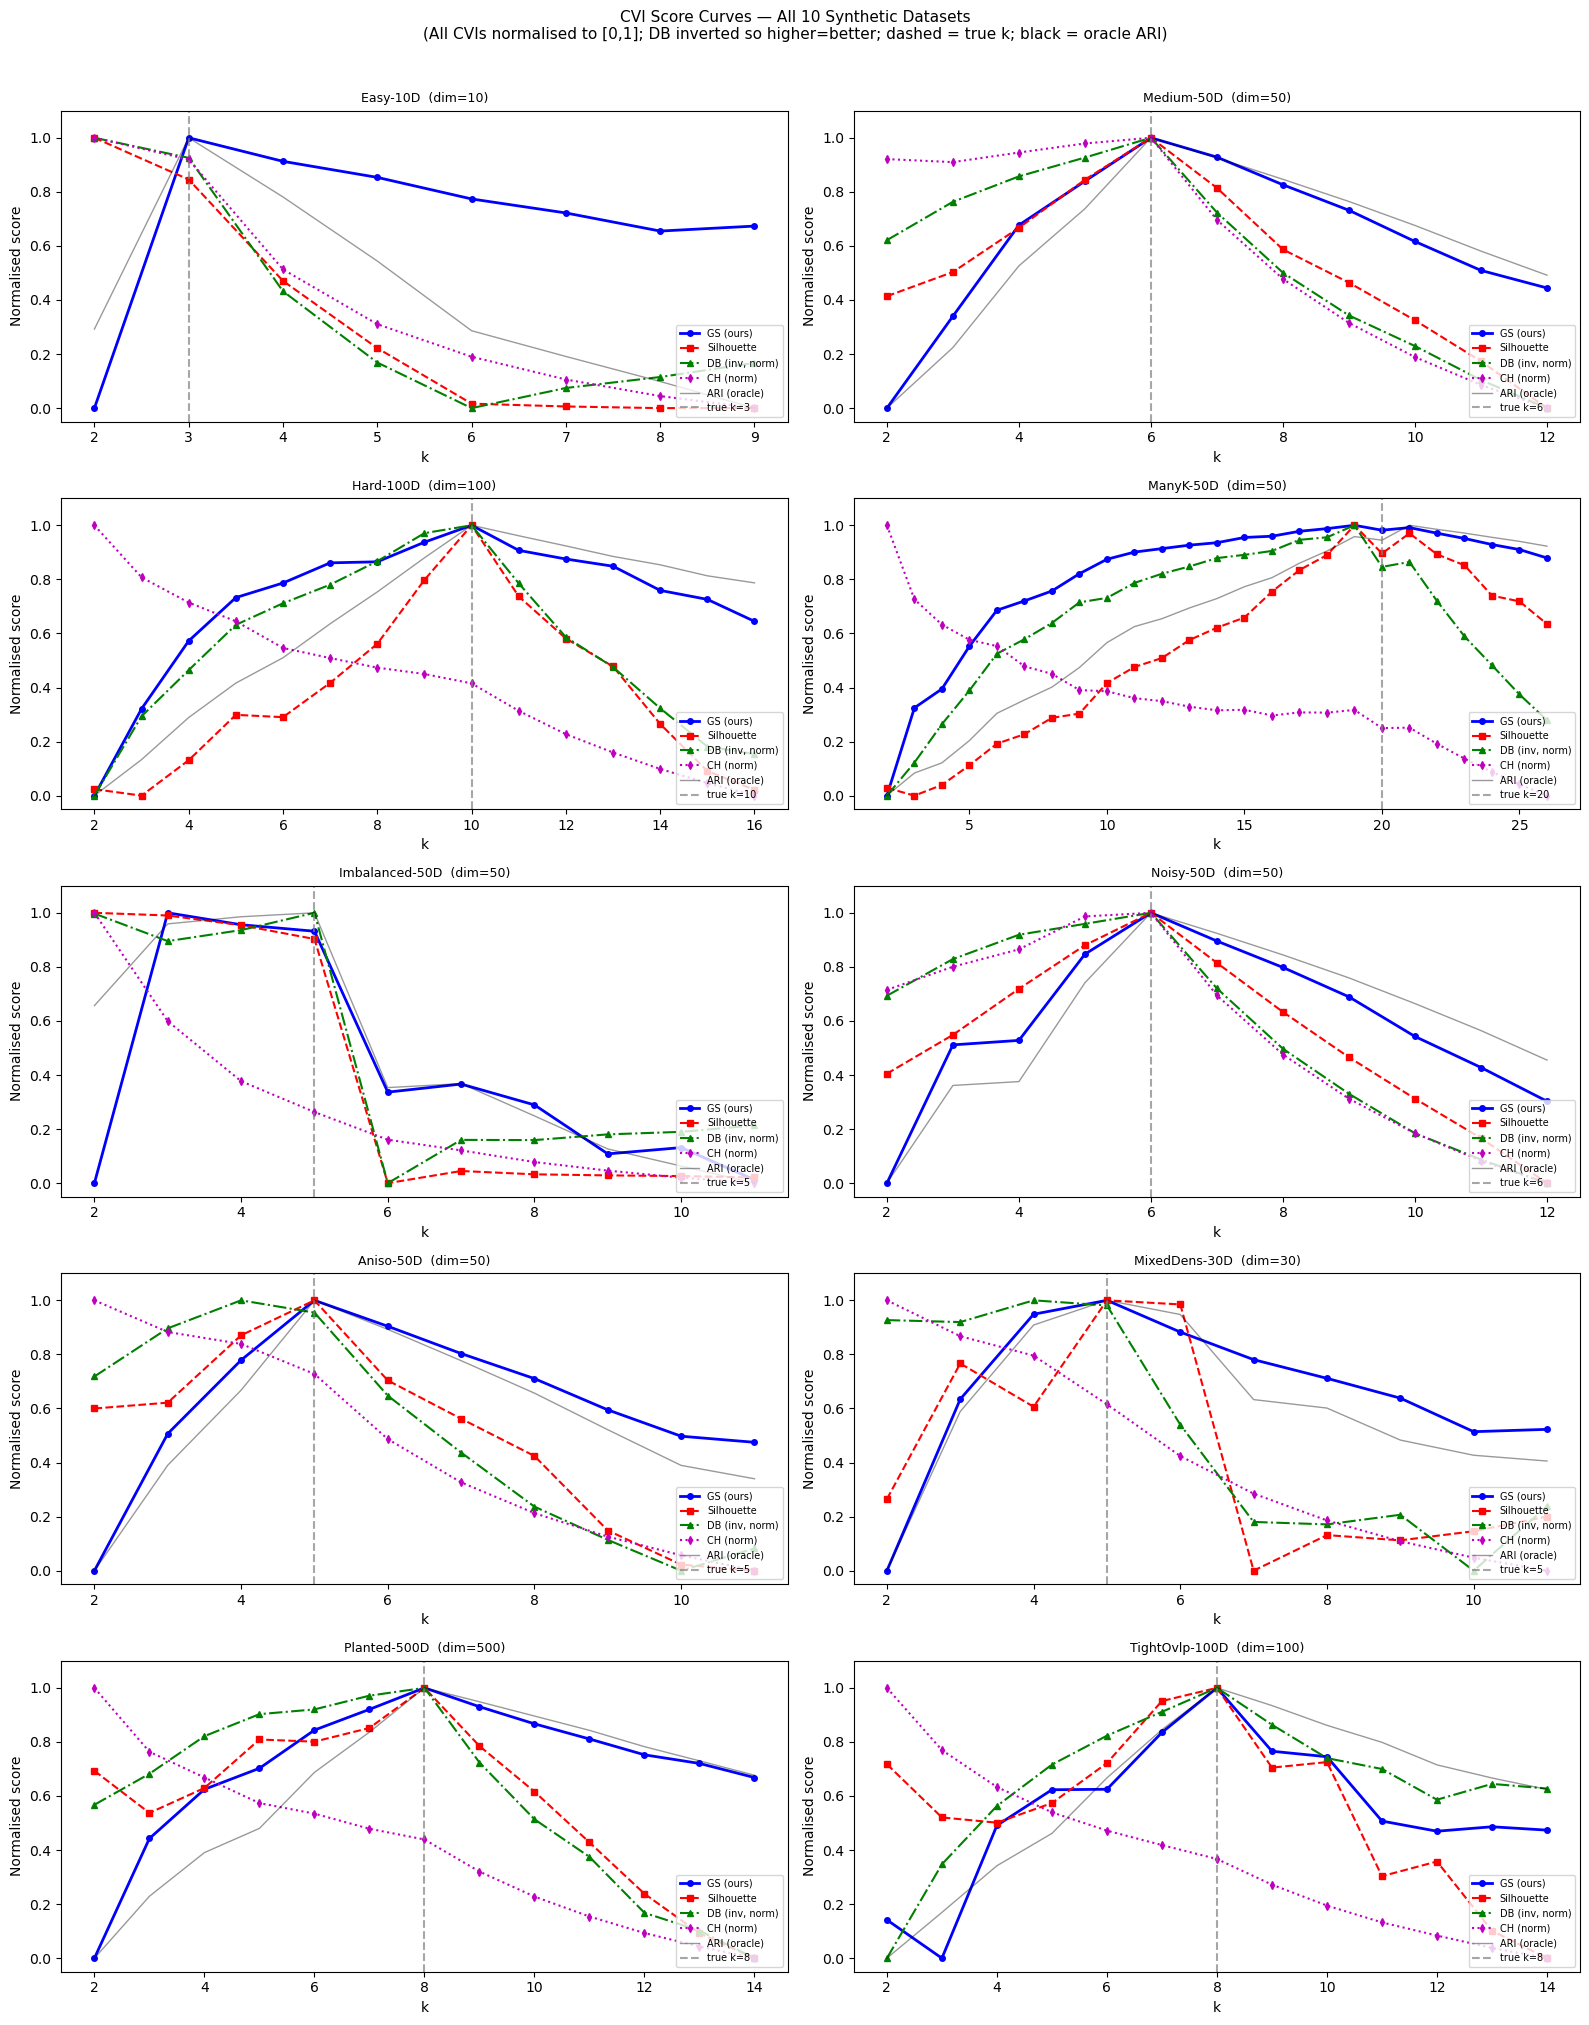
9 / 10
Synthetic benchmarks won
vs Silhouette, Davies-Bouldin, Calinski-Harabasz.

The shape of a working metric.

A good unsupervised k-selection metric should peak at the true number of clusters. The plot below shows score-versus-k curves across all 10 synthetic benchmark datasets. The dashed vertical line marks the true k. Graph-SCOPE peaks at the true k on 9 of 10 datasets; competitors fail systematically at higher dimensions and on imbalanced or anisotropic data.

CVI score curves across 10 synthetic datasets, comparing Graph-SCOPE Silhouette Davies-Bouldin Calinski-Harabasz
Score-versus-k curves for Graph-SCOPE (GS, blue), Silhouette (red), Davies-Bouldin (green), and Calinski-Harabasz (purple) across 10 synthetic datasets. The grey curve is oracle ARI; the dashed vertical line is the true k. Graph-SCOPE peaks at the correct k in 9 of 10 datasets — including Hard-100D, Planted-500D, and TightOvlp-100D where all three competitors fail. Source: GraphSCOPE_Synthetic_Benchmark.ipynb (img-001)

Summary across 10 synthetic benchmarks

MethodMean ARIDatasets won
Graph-SCOPE0.9009 / 10
Silhouette0.8371 / 10
Davies-Bouldin0.8350 / 10
Calinski-Harabasz0.4500 / 10
Oracle (knows true k): 0.902

Graph-SCOPE achieves 99.8% of oracle performance. It is, in practice, as good at choosing k as knowing the answer in advance.

Five components. One diagnosable score.

Like SCOPE, Graph-SCOPE is decomposable. When clustering quality drops, the components reveal which structural property is failing — modularity (community structure), consistency (label stability across resampling), boundary integrity (correct edge handling), noise (unassigned points), or balance (cluster size distribution).

ComponentWeightDiagnostic signal
Modularity60%Community structure on the kNN graph (Reichardt-Bornholdt formulation)
Consistency20%Label stability across bootstrap resampling
Boundary10%Edge integrity between adjacent clusters
Noise5%Fraction of points unassigned
Balance5%Distribution of cluster sizes

The High-D stack is the strongest choice when…

• The data has more than ~30 informative dimensions in its raw form.
• Dimensionality reduction destroys interpretive structure (gene expression, materials properties, multi-modal sensor data).
• The application requires labeling every data point with high confidence.
• Datasets are large enough that re-tuning at scale is operationally prohibitive.
• Discovery is the goal: finding patterns that did not exist before in any database.

For genomics, materials informatics, drug discovery, astronomy, and climate-science workflows, the High-D stack is the only known clustering pipeline that operates correctly on the raw data across all four operational axes: dimensionality, scale, completeness, and tunability.