Structure·Centric ML
Field Note No. 05  ·  Structure-Centric ML
arXiv: 2603.13339  ·  A. Elmahdi, PhD
One paradigm. Three independent scientific domains. The same structural advantages.

Cross-domain validation.

Genomics, materials science, and natural language processing share no surface similarity. But they share the same underlying mathematical problem — finding structure in high-dimensional, ambiguous, sometimes sparse data — and structure-centric methods solve it the same way in all three.

Gene module discovery the gold standard missed.

Gene co-expression module discovery is one of the foundational tasks in cancer genomics. WGCNA — the field's most-cited tool, with over 18,000 academic citations — has been the standard since 2008. WGCNA assigns each gene to a co-expression module or to a "background" pool that the algorithm cannot interpret.

Lung adenocarcinoma — GSE31210 (n = 246 patients, 246 dimensions)

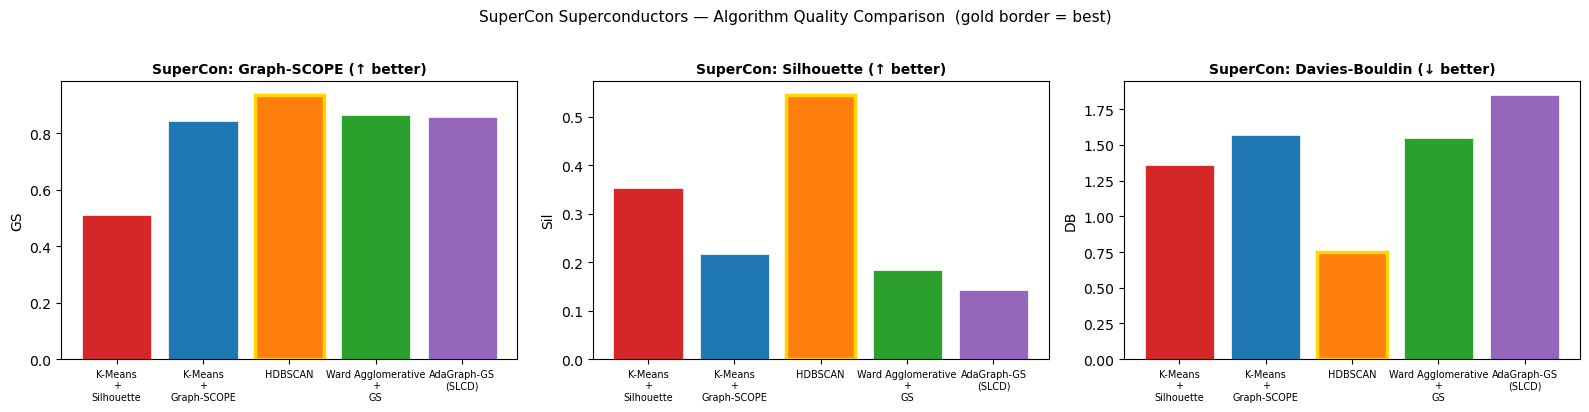
The combined head-to-head scorecard against four established methods (WGCNA, K-Means, Ward, HDBSCAN): 24 wins, 3 ties, 13 losses across 40 head-to-head comparisons spanning multiple quality and biological-coherence metrics. Most importantly: WGCNA placed 76.3% of genes into its uninterpretable "background" pool. AdaGraph clustered 100% of genes into 12 modules.

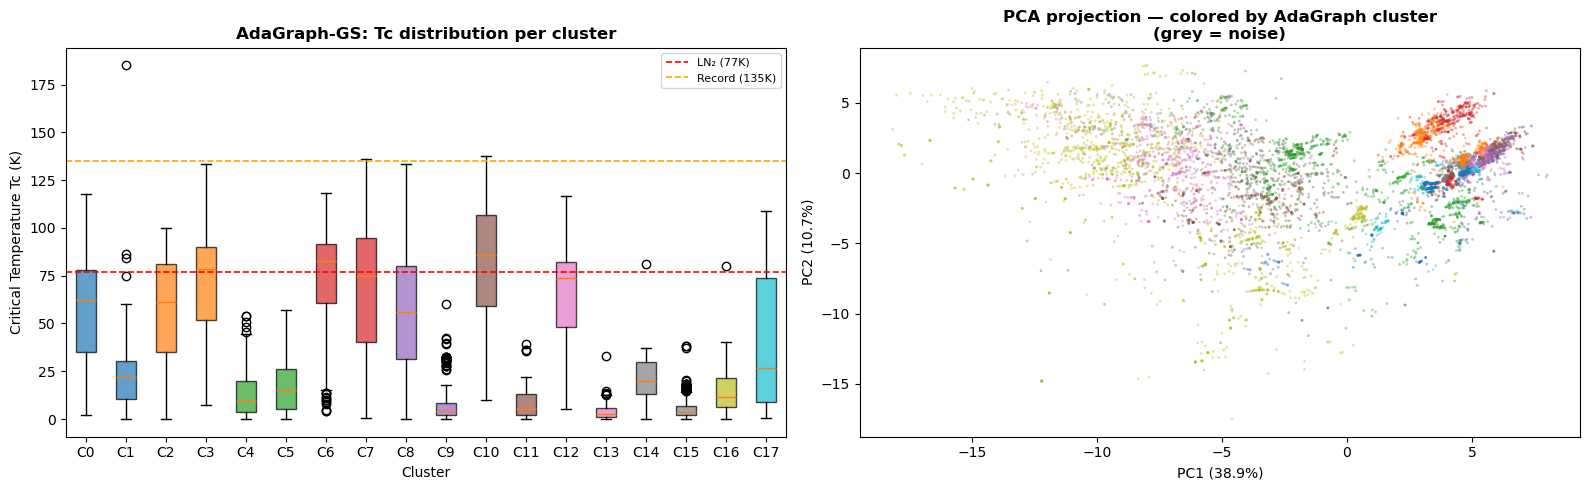
AdaGraph identified a 44-gene smoking-relapse interaction module (cluster C6) in the lung cancer dataset that WGCNA distributed across its background pool, recovering only 2 of the 44 genes. An independent literature validation of every gene-cluster assignment found zero contradictions with established cancer biology, and identified 5 novel candidate genes for experimental follow-up: LOC101060363, TMA7, IRF2BPL, RPS4XP2, MIR6805.

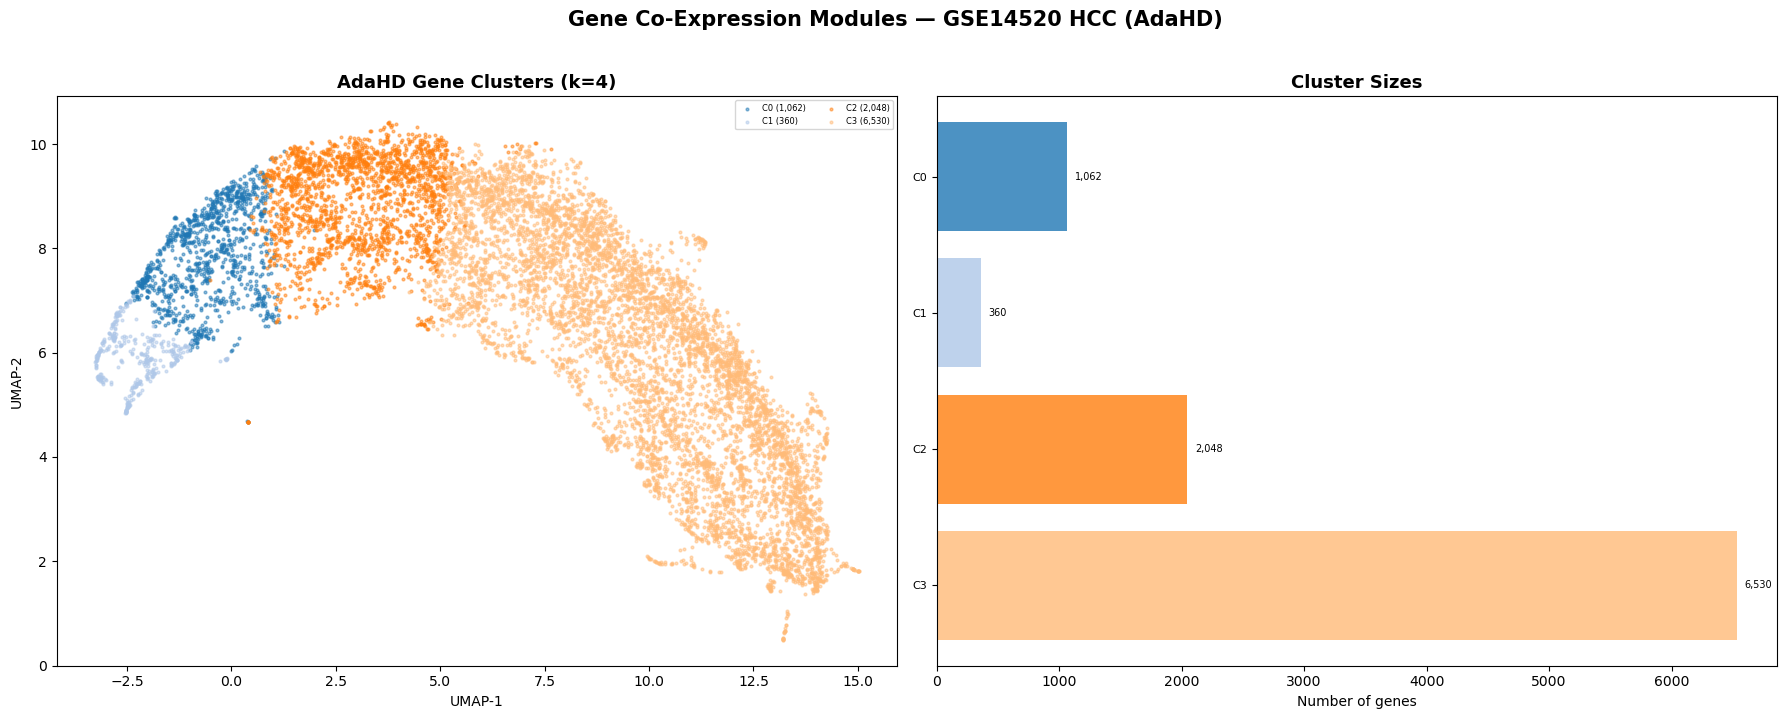
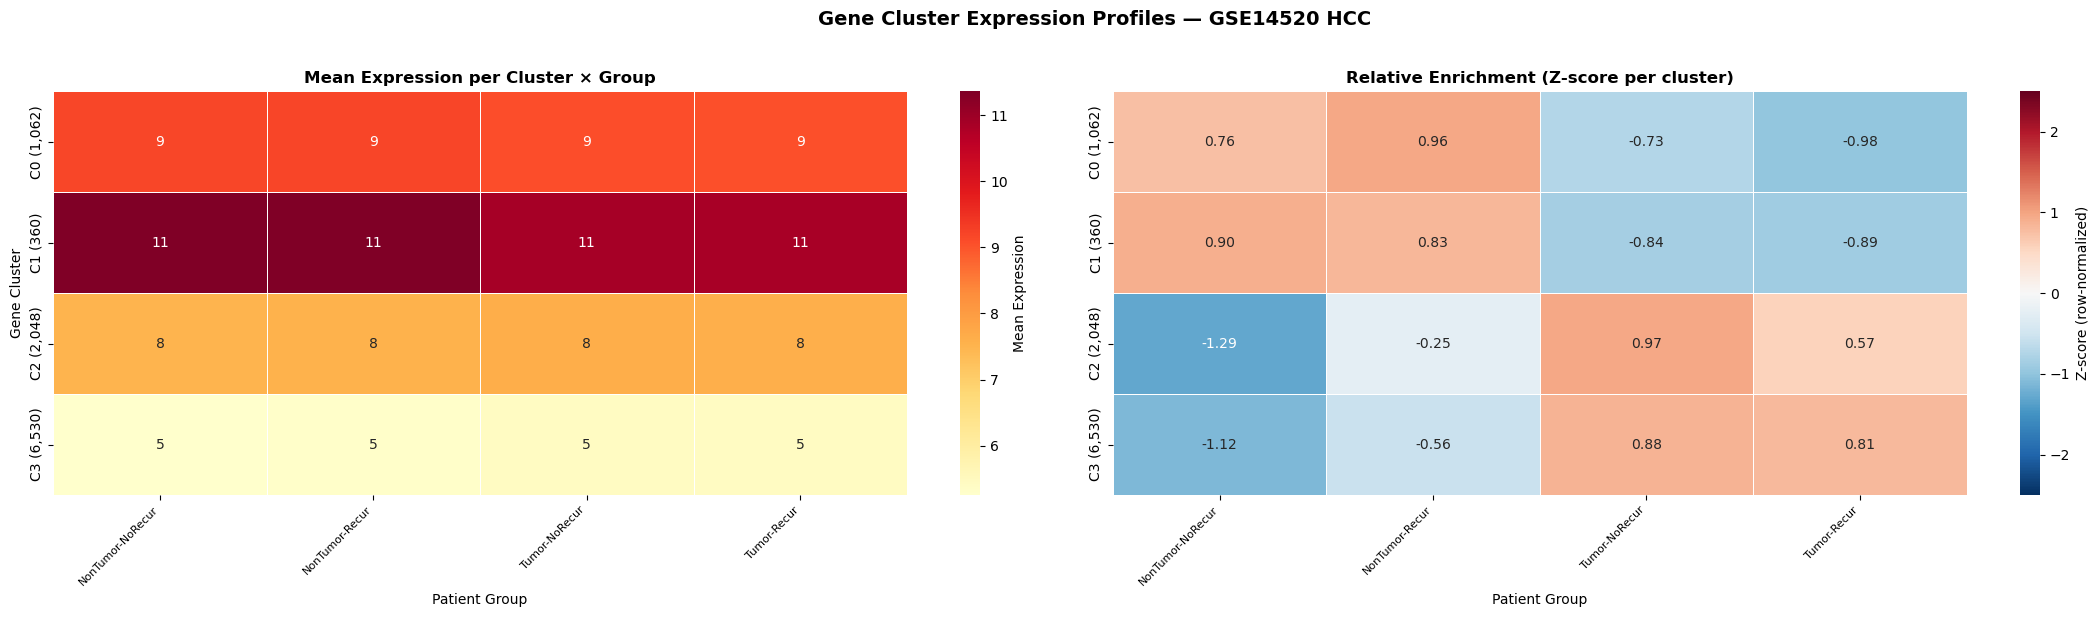
Hepatocellular carcinoma — GSE14520 (n = 431 patients, 10,000 genes)

AdaHD gene co-expression modules in GSE14520 hepatocellular carcinoma
AdaHD identified four gene co-expression modules with 0% noise: C0 (1,062 genes), C1 (360 genes), C2 (2,048 genes), C3 (6,530 genes). WGCNA placed 96.9% of genes into its background pool on this dataset. Source: Gene_Discovery_AdaHD_GSE14520.ipynb (img-002)
Gene cluster expression profiles across patient groups
Mean expression and relative enrichment per cluster across four patient groups (NonTumor-NoRecur, NonTumor-Recur, Tumor-NoRecur, Tumor-Recur). Cluster C2 (2,048 genes) shows the Tissue × Recurrence interaction signature; WGCNA recovered only 41 of these genes. Source: Gene_Discovery_AdaHD_GSE14520.ipynb (img-003)

The BERTopic pipeline, made three times more accurate.

Text clustering at production scale runs on the BERTopic pipeline: sentence-BERT embeddings, UMAP reduction, density-based clustering. The benchmark below tests four clustering options on this exact pipeline across four real-world datasets.

Quality metrics across 4 datasets and 4 methods
Eight quality metrics (ARI, NMI, AMI, V-Measure, FM, Homogeneity, Completeness, SCOPE) across four real text datasets. AdaHD (green) wins SCOPE on every dataset and ARI on three of four. Source: Multi_Dataset_Text_Benchmark.ipynb (img-001)
AG-News UMAP scatter, ground truth vs HDBSCAN vs HDBSCAN* vs Ada2D vs AdaHD
AG-News, 4 categories, n=7,600. HDBSCAN finds k=5 with 4% noise (ARI 0.543); HDBSCAN* fragments to k=29 with 26% noise (ARI 0.186); Ada2D finds k=3 (under-clusters); AdaHD finds k=4 with 0% noise (ARI 0.445). AdaHD recovers the correct cluster count exactly. Source: Multi_Dataset_Text_Benchmark.ipynb (img-006)

Average across all four datasets

MethodAvg ARIAvg SCOPE
AdaHD (high-D structure-centric)0.50150.7604
Ada2D (low-D structure-centric)0.42610.5766
HDBSCAN* (parameter-tuned)0.36110.3595
HDBSCAN (BERTopic default)0.35160.3017

The structure-centric methods occupy the top two slots on both metrics. The improvement is largest on SCOPE because SCOPE rewards correct cluster count, zero noise loss, and clean boundaries — structural properties that distance-based methods cannot achieve.

Superconductor families, rediscovered without supervision.

The SuperCon database catalogs 21,263 known superconductors with their compositional features and critical temperatures (Tc). Materials scientists have classified these into families — conventional/BCS, iron-based, cuprate, and hydride — through decades of physical and chemical analysis. The benchmark below treats the dataset as if Tc were unknown, asking the algorithms to discover families purely from compositional structure.

SuperCon superconductors algorithm quality comparison: Graph-SCOPE, Silhouette, Davies-Bouldin
Quality metric comparison on SuperCon (n=8,000 subsample, 81 dimensions). HDBSCAN earns the highest Graph-SCOPE score — but does so by fragmenting the data into 152 micro-clusters and discarding 40% as noise. AdaGraph-GS earns 0.859 with 18 physically meaningful clusters and 0% data discarded. Source: MaterialsScience_AdaGraph_Benchmark.ipynb (img-002)
AdaGraph cluster Tc distribution and PCA projection
AdaGraph identified 18 superconductor clusters whose mean Tc distributions align with the known physical classification — conventional/BCS at the low end, iron-based and cuprate families at higher Tc, with the highest-Tc cuprate family reaching 137 K. The algorithm received no Tc information during clustering. Source: MaterialsScience_AdaGraph_Benchmark.ipynb (img-003)

Quality versus interpretability trade-off

MethodkNoise %Graph-SCOPEResult
K-Means + Silhouette20%0.510Uninformative
K-Means + Graph-SCOPE200%0.844Needs k externally
HDBSCAN15240.1%0.938Fragmented; 40% discarded
Ward + Graph-SCOPE190%0.866Hierarchical, no noise model
AdaGraph-GS (SLCD)180%0.859Self-contained, parameter-free, fully assigned
AdaGraph-GS is the only method that explores an unknown materials dataset, automatically determines how many physical families exist, assigns every material to one, and provides a quality score — all without domain knowledge or hyperparameter tuning.
— On the SuperCon benchmark

One paradigm, three domains, consistent advantage.

The cross-domain pattern is what makes the structure-centric paradigm credible as a paradigm rather than a single useful tool. In genomics, the gold standard discards three-quarters of the input. In text, the standard pipeline discards a third of the signals. In materials science, distance-based methods either return uninformative answers (k=2) or fragment the data into uninterpretable micro-clusters. The same structural method outperforms all of them, in all three domains, by addressing the same underlying limitation.